Is The NSA Wrong?

nsa-auge

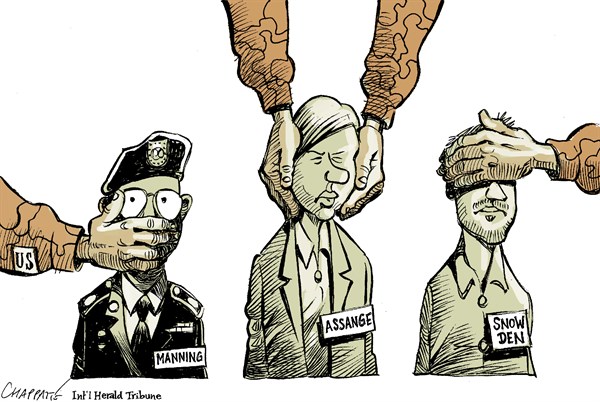
Edward Snowden leaking the NSA surveillance information has clearly caused both a media and social uproar. At this point in time, when American citizens perception of the government is very poor due to extreme partisanship and a recent government shutdown, this scandal only enhanced the publics lack of trust in the United States Government.

However, even though there clearly are multiple  opinions on the the constitutionality and morality of the NSA surveillance, this situation does differ from other similar situations. One relational situation is the IRS targeting scandal. Both of these situations involve the government taking surveillance of persons without them being away of this fact. Both of these situations also raise the questions of if the government is over-reaching its bounds and infringing upon privacy rights by partaking in such actions. However, the clear difference in these situations are that with the IRS, it was a matter of targeting a group of people based on political beliefs. With the NSA, it does not appear that their is any targeting that is not permitted within the “three hops” rule. Although this does allow for a vast amount of people to have surveillance taken upon them, it is still thought that their is probable cause for such surveillance to occur.

Even though the reported number of incidents prevented due to NSA the surveillance went from 54 to 1, it raises the obvious question, is one enough? Although it may be very unnerving to think of how much the NSA knows about you, if this information truly did prevent American lives from being lost, isn’t it worth it? Due to Snowden’s leakage, this debate has begun and will continue for many years, especially given the current political climate.

http://www.veteranstoday.com/wp-content/uploads/2013/10/nsa-auge.jpg


blowerblowerFile-Utah_Data_Center_of_the_NSA_in_Bluffdale_UtahFile-Utah_Data_Center_of_the_NSA_in_Bluffdale_UtahFile-Utah_Data_Center_of_the_NSA_in_Bluffdale_Utah (1)ap132411996867

In an era of fiber optic cables, enabling data to travel up to speeds of 2/3rds the speed of light, and the continuous flow of information across the web puts mass amount of data right at the fingertips of the NSA. As we have already talked about, anonymity is practically impossible when attempting to live a convenient life. However, it wasn’t until 2013 with the release of the Snowden files did we realize that not only were we not anonymous, but in fact we were actually quite well known.

Using handy counter on The Guardian website and a stop watch, I calculated that the NSA collects, according to The Guardian, around 20 terrabytes of information per minute. Most of this data would be turned around and stored in the NSA’s new Utah Data Center which, according to Fox News, cost the taxpayers $1.7 billion to build. Forbes.com estimated that this site could hold up to 12 exabytes of information. To put that in perspective lets do a calculation:

1 exabyte= 1,000,000 terabytes

12 exabytes= 12,000,000 terabytes

@ 20 terabytes per minute (12,000,000/20)

The NSA could hold 600,000 minutes of data

600,000 @ 60 minutes per hour (600,000/60)

The NSA could hold 10,000 hours of data

10,000 hours @ 24 hours per day (10,000/24)

The NSA could hold over 416 days worth of data

The NSA could hold all the data they collect, which using the talked about dragnet and the “three hops” would be most of the data available, for over 416 days. After they filter through the data to determine threat levels of information and remove the information deemed non-threatening, they would have enough space to hold enough data on all terrorist SUSPECTS AND THEIR FIRST TWO HOPS OF FRIENDS for far greater than any of them will actually live. At a time where cyber attacks are a real threat to not only nation security, but also things like economic attacks, identity theft, and anti-western hacking groups, can we trust the government with out data? What right does the government have to bully corporations without warrants like Lavabit to give over users data? These are both questions that need to be answered and are finally being talked about thanks to Edward Snowden.


More information can be found here:

http://www.forbes.com/sites/kashmirhill/2013/07/24/blueprints-of-nsa-data-center-in-utah-suggest-its-storage-capacity-is-less-impressive-than-thought/

http://www.foxnews.com/tech/2013/06/13/what-we3-know-utah-nsa-mega-data-warehouse/

Can There Be More “Snowdens”?

The “NSA Files Decoded” article notes that the NSA dramatically expanded the scope of its surveillance operations after 9/11, in an attempt to close the perceived gaps in America’s security network that may have allowed the attack to succeed. Put simply, September 11th, 2001 was a huge “wake-up call” for the NSA, and served as the catalyst for a great deal of reform and restructuring within the organization.

The Snowden leaks, I’m sure, have forced the NSA to re-evaluate its operations yet again. Whereas 9/11 pointed to a weakness in how the NSA and similar organizations collect information, Snowden’s actions seem to reveal a weakness in how these groups protect their intel.

I, for one, am amazed (and impressed) that a single man was able to leak so much. Of course, “knowing” (or, at least, having access to) necessarily comes before “leaking”, and Snowden definitely knew a lot. Regardless of whether the leaks end up producing any limitations on the organization’s activities, I’m sure that the NSA must be taking every measure possible to prevent this sort of incident from happening again. They can’t really afford “another Snowden,” so to speak.

To this end, the NSA is almost surely re-evaluating exactly who has access to their intel, and just how much access these individuals are granted. Yet they can only do so much. For now, humans are a necessary danger. To make sense and use of the mountains of information they collect, the NSA needs at least some high-authority individuals with the keys to the kingdom. And while these endowed individuals exist, so too does the possibility for more whistleblowers. Whistleblowers who, when acting responsibly, keep tabs on and boldly announce what even the most advanced AI can’t yet compute: the (im)morality of the actions they are witness to. The world needs more Snowdens/leakers/whistleblowers/whatevers – I just hope that there’s still room for them.

http://thecontributor.com/humor/five-cartoons-about-bradley-manning-and-war-whistleblowers

Week 4 Data Collection

I wasn’t able to be in class this week, so instead of gathering data in class, I took a look at how our class used the blog. Specifically, I took a look at the frequency of certain words, similar to the State of the Union Adress database we examined.

Data From 2/3: Reader Blog Posts: How many times did Readers use the following words?

Graphics: 2

Works of Art: 2

Photograph: 1

Hemings Count: 13

Jefferson Count: 27

Slavery: 13

Data: 9

Search: 8

The: 118

 Data From 2/5: Kissinger Questions: How many times were the following words used by groups?

Data/database: 2

How: 7

What: 10

Why: 4

Mean: 4

Textplot: 6

Color: 3

Network: 2

Word: 4


Class Participation by Gender

February 3 Class

Men in class: 25
Women in class: 3

Instances of male participation: 25
Instances of female participation: 4

Male participation ratio (# of male participations: # of men in class) = 1:1
Female participation ratio = 4:3


February 5 Class

Men in class: 25
Women in class: 1

Instances of male participation: 11
Instances of female participation: 2

Male participation ratio ~ 1:2
Female participation ratio = 2:1


Data Collection for Week 4

Tuesday

  • 19/29 students had jackets (66%)
  • 2/19 wore jackets inside the classroom, while 17/19 were placed on chairs
  • Total of 10 drinks on the table (34% of classroom with a drink)
  • 7 waters, 2 coffees, 1 soda, 0 juice
  • 10/29 printed out the articles for the day.

Thursday

  • 14/26 students had jackets (54%)
  • 3/14 wore jackets inside the classroom, while 11/14 were placed on chairs
  • Total of 9 drinks on the table (35% of classroom with a drink)
  • 6 waters, 2 coffees, 0 soda, 1 juice
  • Plus, 1 candy eaten today in class= Skittles
  • 4/26 printed out the article for the day.
  • Time spent chatting with Micki= 25 minutes

Interestingly, out of both day, there was only one person who ate something during class, which was the candy. Also, with the temperature increase from Tuesday to Thursday, less jackets were brought to class as there was a 12 percent decrease.

Speaking Up in Class: Time Log

class layoutFor Tuesday and Thursday’s classes, I logged when and from which table any student spoke up in class to answer a question, share a thought, etc. I arbitrarily assigned numbers to each table according to the diagram on the right.

The data appear below.

Tuesday 2/3/15 Thursday 2/5/15
time table time table
1:42 3 1:42 8
1:44 3 2:10 4
1:44 5 2:22 1
1:45 2 2:25 3
1:46 8 2:32 8
1:46 3 2:33 7
1:53 3 2:34 7
1:54 5 2:35 3
1:55 5 2:39 8
2:04 4 2:43 1
2:05 1 2:44 8
2:07 4 2:52 2
2:08 3 2:53 7
2:09 3 2:54 7
2:10 8 2:55 8
2:10 2
2:10 6
2:10 7
2:11 5
2:12 8
2:13 4
2:28 7
2:30 6
2:30 3
2:32 7
2:32 4
2:33 8
2:34 2
2:36 4
2:36 3

Data Collection for Week 4

Tuesday:

  • Times people spoke up in class: 26
  • People who spoke up: 15
  • The most times an individual spoke up: 4
  • People who shook legs: 7
  • People wearing a shirt: 8
  • People who kept notes with pen/pencil: 7
  • People who yawned: 2
  • Petty actions:
    • Touch chin: 10
    • Touch nose: 4
    • Bite fingers: 4
    • Play with pen/pencil: 4
  • Group discussion:1

Thursday:

  • Times people spoke up in class: 10
  • People who spoke up: 8
  • The most times an individual spoke up: 3
  • People who shook legs: 9
  • People wearing a shirt: 7
  • People who kept notes with pen/pencil: 9
  • People who yawned: 5
  • People who brought laundry to the class: 1
  • Group discussion: 1

Plus: It might be really interesting if observers keep track of how many times people speak up and how many people speak up per week, and make a chart in the end. Just a suggestion!

The Customer Service of Data Visualization

Both Klein and Kaufman wrestle with the idea of transforming archives into information that is quantifiable, visual and meaningful. This approach to interpreting the data available in their respective archives serves to illuminate the nuances of the information that otherwise goes missed.  For Klein, this was the significance of the relationship between Jefferson and James Hemings. She accomplishes this through a novel arc-graph depicting Jefferson’s communications with those closest to him and distantly connected to him. Kaufman, comparatively, illustrates the big topics, timeline and the players that made up Kissinger’s foreign policy through various force-directed diagrams and line and bar graphs. Both strategies, however, beg the question: How can these tools be of use to us if they are not “user friendly” or easily interpreted?

Upon first look, these visualizations have the potential to be detrimentally misinterpreted, even insofar as to negate their purpose. This is especially the case when the conclusions illustrated by the visualizations are not well conveyed or illustrated. In the case of Klein’s arc graph, one could see the person farthest connected to Jefferson, with the “widest” arc diameter, as the person with whom Jefferson most frequently corresponded regarding Hemings. Similarly, without understanding the meanings of the groupings, distances, lines and colors in Kaufman’s force-directed diagrams, the information provided by the visualization is rendered as meaningless as the overwhelming archive itself.

Even if these clarifications cannot be made apparent endogenously, they merit a key or an explanation outside of the visualization. While both Klein’s and Kaufman’s work serves to make large archives more user-friendly and meaningful, they have not gone far enough. Their insights are only as meaningful as they are accessible. We interacted with this idea in ‘The Library of Babel,” where information was existent albeit useless due to its disorganization and lack of availability. Data historians to come will have to discover new ways to not only visualize data but make the user experience as clear, aesthetic and evocative as possible.